Interactive Reports in NAV 2013 R2–Drill Down

In continuation to my earlier post ‘Interactive Reports in NAV 2013 R2 – Dynamics Sorting’, in this session we will see how we can drill down from the report preview to more detailed data

————————————————————————————-

You can refer to my earlier post describing interactive sorting in NAV 203 R2 in the following link –

Interactive Reports in NAV 2013 R2

————————————————————————————-

We will use our existing report designed in my last post [Interactive Reports in NAV 2013 R2] and will incorporate a drill down facility from the ‘Inventory’ column in the report to the Item Ledger Entry corresponding the report’s item No. Probably the design should be as below –

image

Now to achieve this we need to do 3 things –

  • Create a link to ‘Item Ledger entry’ page (Page no 38) and
  • Connect the same link with ‘Inventory’ field in the report and
  • Enable your report to use an external link (URL)

Create a link to ‘Item Ledger entry’ page:

Creating a link to a page in NAV 2013 R2 is simple. Open any Item Card and drill down from the inventory field –

image

This will open the ‘Item Ledger Entry’ page filtered out by the item from whose card you are drilling down –

image

Click on the down arrow key in the upper left corner of the page and go to Page > Copy Link to Page. Open a notepad and paste the link (you need to further edit it)-

image

here is the link URL pasted (This link relates to my NAV server and Company):

dynamicsnav://dss-282:7046/DynamicsNAV71/CRONUS%20India%20Ltd./runpage?page=38&personalization=38& bookmark=12%3BIAAAAACHNAE%3D&$filter=%27Item%20 Ledger%20Entry%27.%27Item%20No.%27%20IS%20%271000%27&mode=View

This link contains a lot of information about the target page and some part of this link can easily be removed to make it more generic. This link has the following information –

Link Text Purpose
dynamicsnav://dss-282:7046/DynamicsNAV71 Target Server Instance and port no
/CRONUS%20India%20Ltd. Target Company
./runpage?page=38&personalization=38& bookmark=12%3BIAAAAACHNAE%3D&$ Target page no 38 and bookmarking
filter=%27Item%20 Ledger%20Entry%27.%27Item%20No.%27%20IS%20%271000%27 Filer information. Here the data is getting filtered by ‘1000’ on ‘Item No.’ field in target data (Item Ledger Entry)
&mode=View Open the page in View mode

So I will remove the ‘Target Server’, ‘Port No’, ‘Target Company’ and the ‘Personalisation’ part to make it usable for any server, any database or company (you can port this object to any other database in any other server and it will work fine). post my changes, the link will look like this –

dynamicsnav://///runpage?page=38&filter=’Item Ledger Entry’.’Item No.’ IS ‘1000’&mode=View

[I have replaced the %20 with space and %27 with a single quote (‘)]

Right now the above link will open the Page 38 filtering the ‘item ledger entries’ with the Item No. ‘1000’. We need to change it further to make it filter data dynamically with the item no. from the report. We will make this change directly in report builder in our next step.

Connect the same link with ‘Inventory’ field in the report:

Open the report in NAV 2013 R2 development environment and go to View > Layout. This will open the report layout in SQL Server Report Builder.

____________________________________________

Note: To learn how to use SQL Server Report Builder 3.0 (instead of Visual Studio 2013) for NAV 2013 R2 report layout designing, you can refer to my earlier post NAV 2013 R2 Report layout design with Report Builder

____________________________________________

image

Right click on the ‘Inventory’ textbox and go to ‘Text Box Properties’.

image

Go to ‘Action’ tab and select the radio button in ‘change action option’ to ‘Go to URL’. After this click on the ‘fx’ (as circled above) button next to ‘Select URL’ text box.

image

Here I have modified the URL with the following changes:

  • Added a ‘=’ sign in front of the URL
  • Included the entire URL inside double quotes
  • Replaced the text ‘1000’ (the item no.) with the text ‘+Fields!No.Value+’. This makes the URL to pick up the Item No. from the value displayed in ‘No.’ field in report.

____________________________________________

Instead of manually typing it, you can actually select the ‘Fields (DataSet_Result) in Category box, Select ‘<All>’ in Item box and then  double-click on ‘No.’ in the Values box.

____________________________________________

Post the above changes, my final URL looks like this –

=”dynamicsnav://///runpage?page=38&$filter=’Item Ledger Entry’.’Item No.’ IS ‘”+Fields!No.Value +”‘&mode=View”

Now the field ‘Inventory’ is perfectly linked to the page 38 (Item Ledger Entry). Next let us complete our 3rd step –

Enable your report to use an external link (URL):

Save the report layout and come back to NAV 2013 R2 development environment (Report designer). Go to a blank line at the bottom of the report and click on View > Properties –

image

Change the property ‘EnableHyperlinks’ to ‘Yes’.

And that’s it. You are ready with your NAV 2013 R2 interactive report from where you can drill down to more detailed data. Let us test the same.

Save the report and run it from the Object designer itself (that’s the good thing you can do in NAV 2013 R2 but not in NAV 2009 Smile).

Once the request page opens, just click on the ‘Preview’ button. This will open the report viewer window. Hover your mouse on the ‘Inventory’ field values and you will see the cursor is getting changed to a ‘hand’ denoting that you can drill down from that value. Click on the value and Item ledger entry page will open up with the entries corresponding to the item no in the report.

image

Try and see if all values are opening it’s corresponding item ledger entries only.

Hope you are able to follow the steps mentioned here in creating your own interactive reports. You can leave your comment here in case you face any difficulty or you can write to me on the same at snehanshu.mandal@gmail.com.

Catch you in my next post / session on NAV 2013 R2. Till then happy reading.

Interactive Reports in NAV 2013 R2

With the world cup football 2014 in full swing, I am struggling to catch up up with my goal of weekly post to my blog Smile. But thought of catching up on the same today.

In this edition of post, let me show you some of the interactive features of Microsoft Dynamics NAV 2013 R2 reports

NAV 2013 R2 reports can be pretty interactive in terms of –

  • Interactive sorting
  • Drilling down to detailed data
  • Toggling the visibility of any field [say image] based on user action.

These features are kind of giving more power to end users of NAV to view their reports in their own way. Let them decide how they want to sort the report and help them with details of information wherever possible.

To demonstrate the same, let me create a report in NAV 2013 R2 and take you through these interactive features.

I will create a simple report based on Item Master – ‘Item List Interactive’ with the following columns displayed in the report –

  • – No
  • – Description
  • – Base Unit of Measure
  • – Costing Method
  • – Inventory and
  • – Picture of the item

So I opened the developer environment of NAV 2013 R2, created a new report and inserted the DataItem with the Data Source ‘Item’ table and added the above mentioned columns in the Report Dataset Designer as below –

image

Now let us design the layout of the report. [I am using SQL Server 2012 Report Builder 3.0 for layout Designing]. Go to View > Layout and this will open the Report Builder’s Layout Designer [a blank one]. Just add a table and drag and drop the fields displayed in Dataset_Result under the group Datasets in the Report data pane in the left [You could use a Table Wizard (Insert > Table > Table Wizard) also to include the fields in the layout] –

image

Your layout will look more or less similar to my above screenshot.

——————————————————————————————————————————

[Note: Use a image control instead of a textbox control to display the picture field. Otherwise the the picture column will not show the images of the items and will display an ‘Error’ wherever picture is present for the item.]

——————————————————————————————————————————-

Now your basic report is complete. Close the report builder and save the report and run it from the object designer itself. Though we have not selected any key in the DataItem’s property ‘DataItemTableView’, you will see that the list of items are sorted on [No] column as that’s the primary key of the item table.

image

Also, wherever the item has a picture stored in the database, the same will be displayed in the Picture column of the report.

image

Our next job is to make it more interactive and enable the major columns [Say ‘No’, ‘Description’ and ‘Costing Method’] dynamically sortable during runtime. For that we will go back to our report and open the layout in report builder.

In the layout design, right click on the header textbox of the [No] column and open the text box properties.

image

In the properties window, go to the Interactive Sorting tab and in the right hand side pane, tick the [Enable interactive sorting on this text box]

image

Keep the [Choose what to sort] on [detail row] selected and go to the field [sort by]. Here select [No] column. Click on the ‘Ok’ and you are done with making the [No] column interactively sortable during runtime.

Similarly make the [Description] and [Costing Method] column interactively sortable by repeating the above steps (Right click on the header of the column and open the text box properties. Go to the interactive Sorting tab and tick the [Enable interactive sorting on this text box]. Also select the corresponding field in [sort by]) .

Save the report layout and come out of the Report Builder. In NAV report designer window, click anywhere and it will prompt you to synchronise the report object and the modified RDLC [.rdl] file –

image

——————————————————————————————————————————-
[This happens every time you modify anything in the report layout in either Report Builder or Visual Studio and come back to NAV report designer]
——————————————————————————————————————————-
Say yes and save & compile the report.

Let us test how the report is behaving now after all the above changes. Select the report in Object Designer window and run it. This will open the request page of the report where click on the preview button to display the report –

image

In the preview, immediately you can notice that there are some visual changes in the report and the [No], [Description] and [Costing Method] columns have up/down arrows in their header. This denotes that these columns are enabled with interactive sorting.

Click on the column header of [No] and you will see the sorting of the data is getting changed from ascending to descending and if you click again, the sorting is reverting back to ascending way. The same sorting behaviour you can see for the other 2 columns too ([Description] and [Costing Method]).

image

So, we just made our simple ‘Item List Interactive’ report dynamically / interactively sortable on the basis of multiple columns.

That’s closes this session on Interactive features of Microsoft Dynamics NAV 2013 R2 reports. Do send / write to me your feedback on the same. In my next session I will continue with my discussion on rest of the interactive features [Drill down and Image Toggling] of NAV 2013 Report. Till then happy reading and enjoy the Football World Cup matches Smile.

[Going to watch Brazil vs Mexico match tonight]

NAV 2013 R2 Report layout design with Report Builder

I was travelling to Kochi, Kerala to conduct a 6 day session on NAV 2013 R2 topics to a bunch of guys from one of the Microsoft Partner. it was 3 months back and as client requested to demonstrate the topics in NAV 2013 R2, I upgraded my laptop with NAV 2013 R2 from NAV 2013 FP1.

During the training, when we reach the topics on Reports, I got a rude shock that my report layout  design is no longer opening and its throwing an error as below (though I have visual studio 2010 installed in laptop) –

image

Normally I ensure to keep all dependent software of NAV installed right in my laptop. But this time I missed out the fact that NAV 2013 R2 is no longer compatible with Visual Studio 2010. Rather it needs VS 2012 or higher.

Now I got a situation here as I even don’t have the installable of Visual Studio 2012 / 2013  and I need to demonstrate the report designing features to my audience.

Fortunately with my installation of NAV 2013 (R2), the SQL Server 2012 express version was installed and along with that, the Report Builder 3.0 too was got installed in my Lapi. Though I was more comfortable in designing the reports in Visual Studio, but I quickly adapted to the new environment and managed the show perfectly. And trust me my audience was happy .

So the fact is that –

  • NAV 2013 R2 no longer uses Visual Studio 2010 for report layout design. Rather it looks for Visual Studio 2012 / 2013.
  • If you don’t have the Visual Studio 2012 / 2013, you can still manage to design the report using Report Builder 3.0. This is a component of SQL server 2012 reporting services and gets installed when you install SQL server 2012.
  • Among the 2 report authoring tools, Visual studio is still the default report authoring tool.  So even though you have the Report Builder 3.0 in your machine, you will see that NAV 2013 R2 is looking for Visual Studio 2012 / 2103 and still throwing the above mentioned error (picture).

To make NAV 2013 R2 use Report Builder 3.0, you need to change an option property in your NAV environment. To do the same –

  • Open NAV 2013 R2 development environment.
  • Go to Tools > Options. the below mentioned screen will open –

image

  • Change the ‘Use Report Builder’ property to ‘Yes’. The default value will be ‘<No>’.
  • Press ‘Ok’.

Once this is done, NAV 2013 R2 will no longer look for Visual Studio 2012 / 2013 and will open the Report Builder 3.0 for designing the report layout.

Note: If you are interested in knowing the difference between designing the report in Visual Studio (Report Designer) and designing the report in Report Builder, you can check out the below url for more details  –

Designing Reports in Report Designer and Report Builder 3.0 (SSRS)

Enjoy Reading. I will come back with more topics on report designing soon. bye for now.

Do things differently

To start our discussion, let’s take a simple topic –

Few months back, in one of Orkut forum somebody had posted a problem as follows:

‘I have to pick out a digit from a code field. E.g. Code is ‘50123AD786′ n I have to select 7th character from this field How can this be done…’

You all know it’s simple and the common way to achieve this is:

Copystr([ur code variable],[position, say 7 for 7th position],[length, here for u its 1])

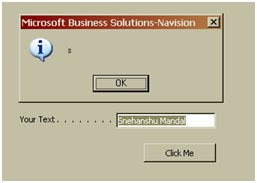
We have designed a new form here. Taken a new global variable called ‘Name’ of data type Text and inserted a text box to display the variable.

We also have written a single line code as per the above syntax to display the 7th character of the ‘Name’ in a message box.

Now, can we do it in not so common way?

Yes, we can if we know that a text string in Navision is nothing but an array of characters (literally). So here ‘Name’ variable is nothing but an array of its length and we can fetch out the 7th character of it by simply referring it as Name[7]. To validate it, let us change the code in the ‘OnPush’ trigger of the Button as below:

Message (FORMAT (Name [7]));

Why we needed a FORMAT command? Just because the message box can only display text not character.

Here I entered ‘Snehanshu Mandal’ in the text box and clicked on the button ‘Click me’. It’s displaying the 7th character of my name ‘s’.

Don’t you think it’s interesting?

How can we make working on Navision a FUN?

Hi friends! How are you doing?

Last month, I completed 6 ½ years working in Navision and was stumped by one of my junior’s question – Don’t you get bored while working with Navision after so many years? Big question.

People are getting bored very fast nowadays. But why? You get bored when –

1. Work is monotonous
2. Work can be monotonous when you know everything and there is nothing new left to learn
3. ‘Hey, I am doing the same form designing, report designing and data port designing’

Besides the above points, you will find plenty of reasons of why people are getting bored in Navision.

I think the answer lies in the approach you have towards Navision. Whether we are trying to solve a problem too technically or we are having a holistic approach to solve a problem? Again to have a holistic approach towards a problem, you need to be little experienced on Navision or you have a fair idea about Navision functional things. So the whole issue is little paradoxical.
Whatever may be the reason, here we are not to discuss the problem. Rather we are here to try & make working on Navision a little more enjoyable. And to make it enjoyable, the best thing is to do something new in Navision every day. Mind it, you can do something new only when you do not know everything but you know something of Navision to start with.

I am not here to teach you something new in Navision rather together we will search new things in Navision. Every day, we will discuss about one topic and if you feel interested, you are welcome to suggest me the future topic or contribute a new discussion. You are welcome to send the problem you are having in your implementation and together we will try to evolve most reasonable solution of it. When so many brains will work on the problem, definitely we will be able to achieve most suitable solution for the problem
So let’s wish ourselves happy learning of Navision.